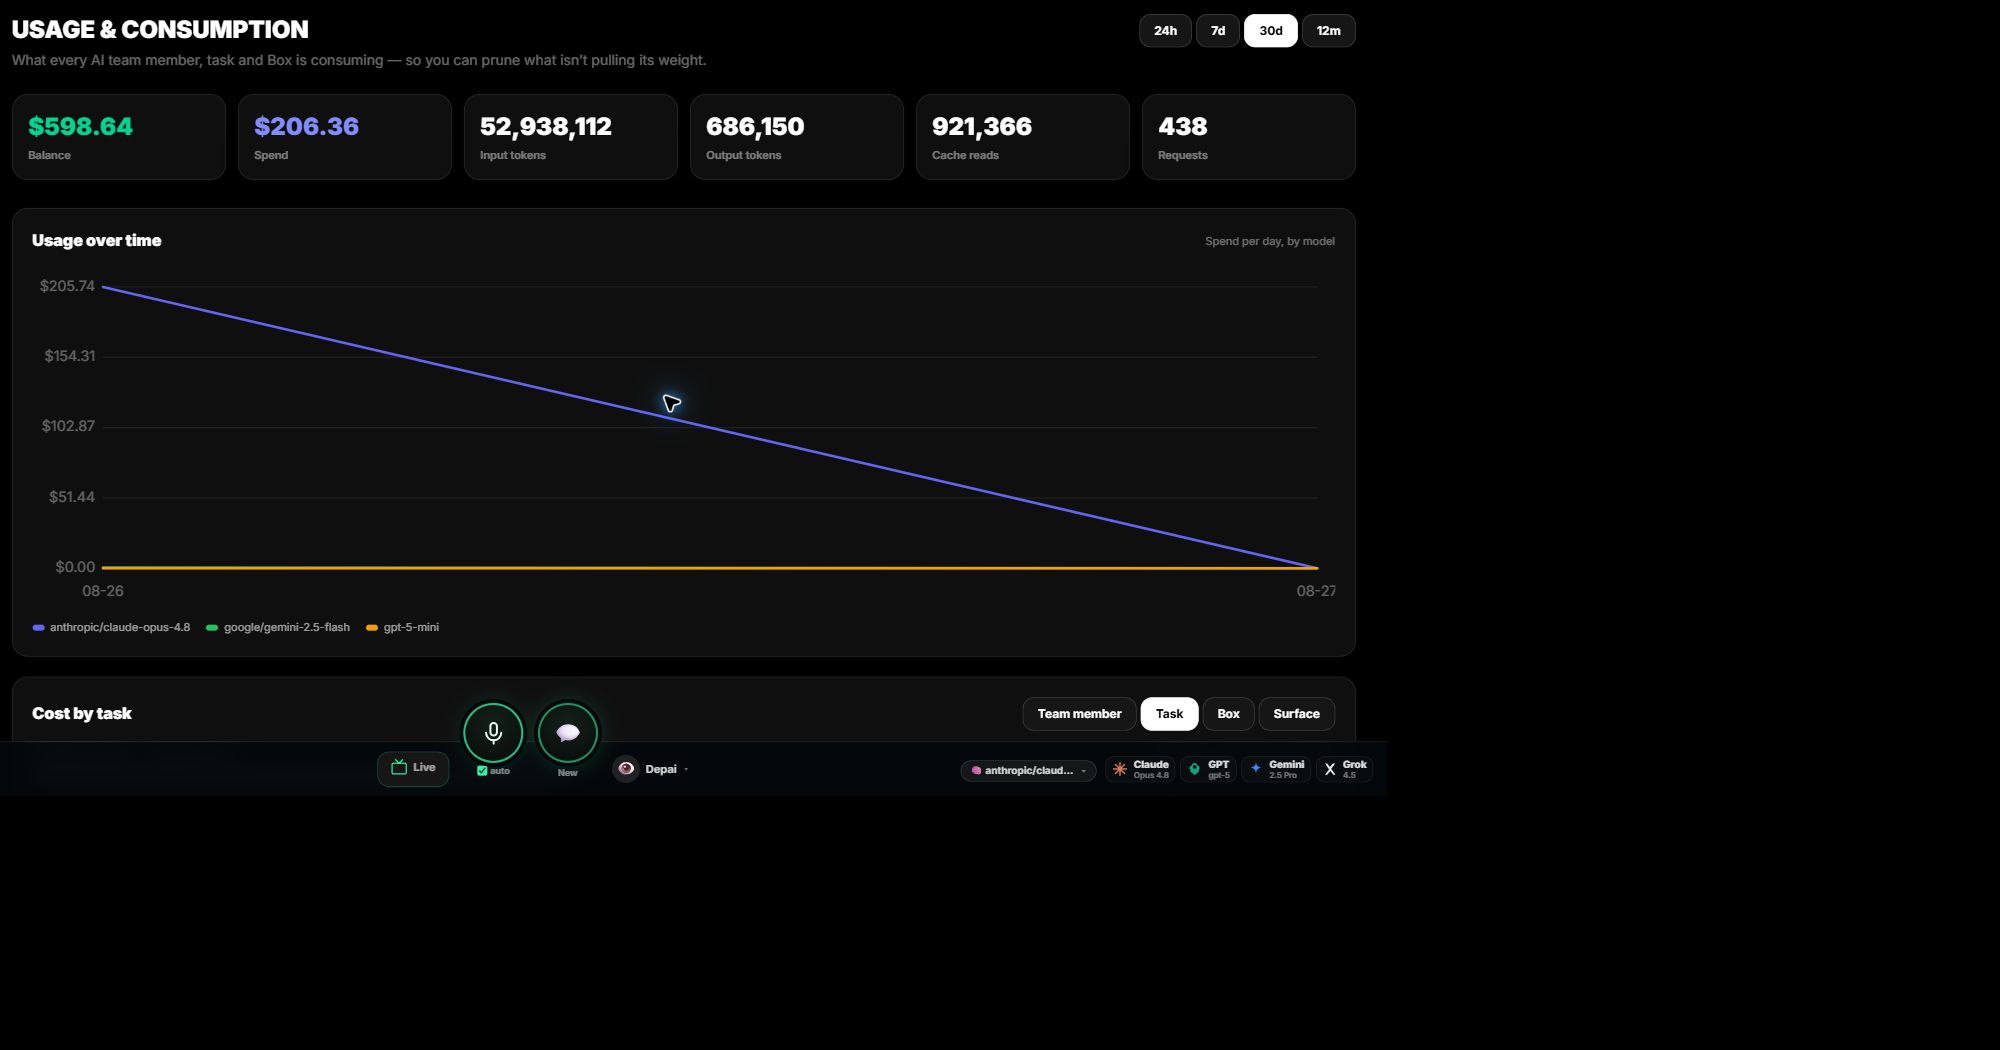
Start with the account summary
Choose a time period and review balance, spend, input tokens, output tokens, cache reads, and requests. The chart shows change over time.
Group cost by the question
Use Task to find expensive work, Team member to compare roles, Box to compare runtimes, Surface to identify request origins, and the model table for provider detail.
Turn the report into a decision
Compare spend with the output, then adjust the workflow, context, schedule, team role, or model when the result does not justify the consumption.
Continue in DPanel
Open the related product area or workflow when you are ready to apply this guide.
Review pricing